The Increasing Importance of the FP&A Function in Healthcare
The FP&A function in healthcare is growing increasingly crucial as senior management of larger healthcare companies consistently looks for greater operational and financial transparency to help them manage the business and control costs.
Large healthcare companies can have hundreds of business locations and thousands of departments across these offices, housing thousands more employees. Large occupancy and physician compensation costs must be carefully budgeted and tracked for strategic planning; however, the FP&A data collection process for these line items can be particularly onerous, often using outdated systems and Excel manipulations.
The implementation of business intelligence tools with existing Enterprise Resource Planning (ERP) systems makes data collection more efficient and timelier, leading to improved reporting and decision-making.
Implementing Business Intelligence Tools
FinServ’s client, a large and rapidly growing healthcare organization, recently implemented a SAAS Facilities Management software for more efficient space utilization and planning to enable the client to track moves/adds and changes to departmental space at every location. Prior to the implementation, the departmental space usage was tracked in an Excel file, so the data quickly became stale as departments changed locations or moved from one floor in a building to another. Since occupancy costs are budgeted and allocated to each department based on square footage, the stale square footage numbers became meaningless with respect to budgeting and allocating actual occupancy costs to the respective departments.
The project was a significant undertaking. Floor plans for hundreds of locations had to be obtained and converted from PDF to CAD format, and the space on each floor required confirmation from the respective clinical managers in each department. The successful implementation allowed the company to update moves/adds/changes to the real estate portfolio on a timely basis, providing efficient data collection and reporting on departmental occupancy costs in the FP&A process. This allowed management to make more timely decisions on the use of space. The software also enables the organization to manage its vacant space and incorporate that information for the planning and budgeting for new providers. Combining this information with operational statistics such as patient volumes allows management to forecast profitability by location and make decisions to expand or close locations based on that profitability. The company can now decide on the quality of staff at specific locations using clinical data on patient volumes and satisfaction to make staffing and compensation decisions.
Overhauling the Compensation Process
Our client’s physician compensation process was similarly complicated and outdated. The methodology of compensating physicians is also constantly changing. At one point, physicians were compensated on the P&L they generated, which forced physicians to spend time managing their costs, such as the number of clinical staff they required to support them. Physician compensation, or “Phy Comp” was also tracked and calculated in Excel, which was unsustainable for a rapidly growing company.
The implementation of Business Intelligence tools with the company ERP systems gave the company the transparency to work relative value units (“wRVU”), which are standard units of measurement used to establish values for health care procedures or codable direct patient care experiences. The transparency of this data enabled the company to move to a production-based compensation plan for physicians, which allows physicians to spend less time managing their costs and more time dedicated to patient care.
The company is also moving towards value-based-pay incentives as more data around the patient care experience has become available in the ERP systems. The company has also undertaken a project implementing a compensation system to automate salary and bonus calculations, documenting processes and controls for IPO readiness. All these project improvements will streamline the FP&A processes with respect to Phy Comp.
Forward-thinking healthcare companies are also adopting the Financial Services model of offshoring support functions of their ERP systems to low-cost locations like India. These cost-effective managed services offer excellent support to resolve issues through the client support ticketing process quickly.
Technological improvements to ERP systems result in improved transparency of clinical data from billing systems. This allows for a more granular process in using detailed data for financial analytics and forecasting and can significantly impact financial results when utilized effectively by management.
Conclusion
FinServ Consulting, LLC has technical expertise with respect to systems, data collection, and US GAAP accounting to add value to healthcare companies, including the FP&A and ERP domains. Our team is well-positioned to help ensure the success of your next project. If you would like a full picture of FinServ’s methodologies or capabilities in running a project for your healthcare organization, please contact FinServ Consulting at info@finservconsulting.com or call 646-603-3799.
About FinServ Consulting
FinServ Consulting is an independent experienced provider of business consulting, systems development, and integration services to alternative asset managers, global banks and their service providers. Founded in 2005, FinServ delivers customized world-class business and IT consulting services for the front, middle and back office, providing managers with optimal and first-class operating environments to support all investment styles and future asset growth. The FinServ team brings a wealth of experience from working with the largest and most complex asset management firms and global banks in the world.
Intelligent Business with Power BI
In order to understand the capabilities of Power BI, it is best to start with the fundamentals of Analytics & Business Intelligence (“ABI”) and data visualization. The combination of ABI and data visualization allows Power BI to articulate information in a digestible manner that is supportive of intelligent decision making.
ABI tools are user-friendly data management platforms that emphasize self-service and provide analytical functionality ranging from data preparation to insight generation. Business Intelligence (“BI”) leverages historical information while analytics employs modeling and statistics to anticipate future events. Generally speaking, BI is focused on what happened, and analytics is focused on why it happened.
Data visualization is the presentation of information through graphical mediums like charts, diagrams, dashboards, and more. Dashboards are an amalgamation of components designed to inform stakeholders in an aesthetically pleasing manner like the sales dashboard below. The goal is to provide an informative platform that is far easier to comprehend than traditional resources such as a spreadsheet with thousands of rows.

Power BI and Its Key Features
Power BI is a business intelligence solution that enables companies to draw organizational insights by using data visualizations, performing analytics, connecting to hundreds of data sources, and embedding content into external applications & websites. An additional benefit enjoyed by users on the Windows platform is its seamless integration with the Microsoft suite. In summation, Power BI allows users to connect, prepare, model, and visualize data.
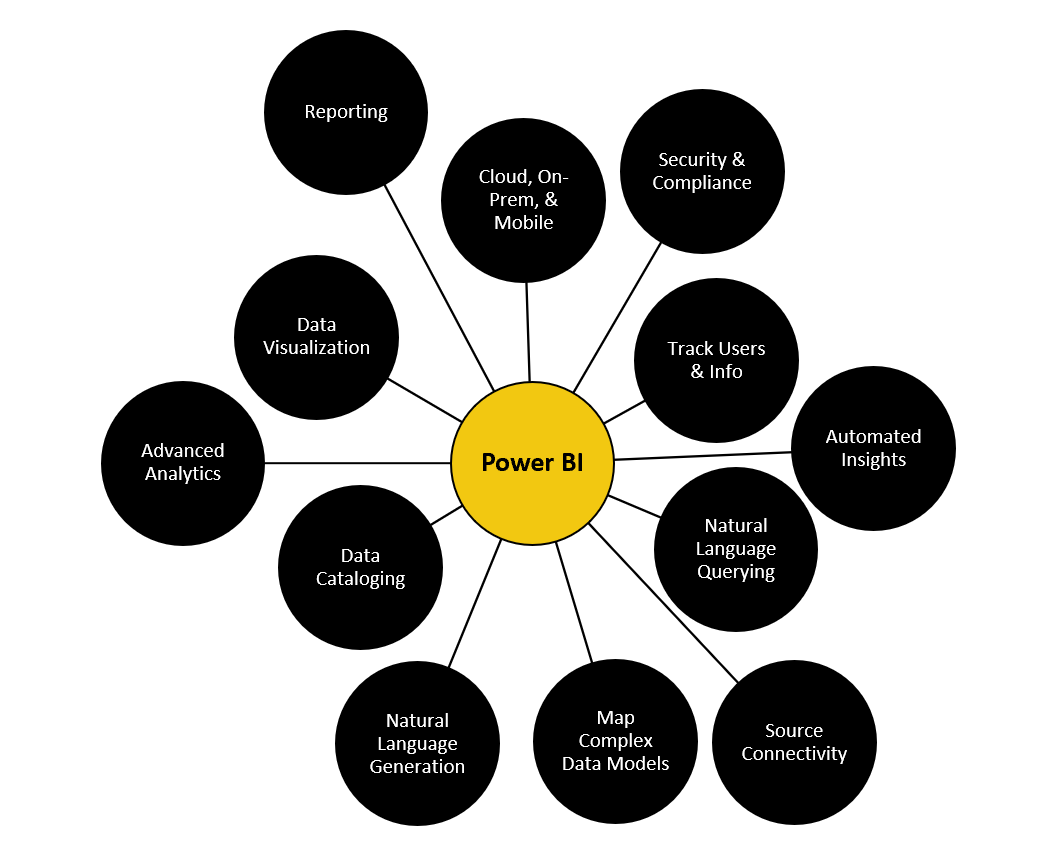
Power BI incorporates numerous features (illustrated above) that assist in the analysis and comprehension of a business. Three particularly impressive features included in Power BI’s repertoire are Natural Language Generation (“NLG”), Automated Insights, and Advanced Analytics. NLG uses artificial intelligence to automatically produce rich text descriptions detailing outputs. Automated Insights are conceived from advanced algorithms and are a great way to initiate analysis on large data sets. While the initial analysis generated from Power BI can provide direction for additional research and evaluation, other factors may be sufficiently analyzed within Power BI without the need for further investigation. Advanced Analytics can be performed with Power BI’s internal ABI platform and/or by integrating with external models. Azure Machine Learning Studio’s drag and drop interface can be combined with SQL and R to conduct predictive analytics on data sets.
Subscription Options and Functionality
The three versions of Power BI are Desktop, Pro, and Premium. Desktop, the lowest-tiered option, can be downloaded from the Microsoft Store for free. It includes the core data visualization and analysis features; data preparation, reports, dashboards, connection to over 50 data sources, and the ability to export in various formats.
Pro includes all of Desktop’s functionality and can be purchased as a standalone product for an annual subscription of $10 per user license per month or as part of the Microsoft Office 365 Enterprise E5 suite. The enhancements differentiating Pro primarily fall under collaboration and the distribution of content. For example, users can share their insights by embedding visuals within applications such as SharePoint and MS Teams. Furthermore, users can leverage peer-to-peer sharing to distribute their work to external stakeholders with Power BI Pro licenses.
Premium, the most advanced offering, comes at a hefty annual subscription that breaks down to a monthly price of $4,995 per dedicated cloud compute and storage resource. Some distinguishing characteristics that amplify data analysis include enterprise level BI, cloud & on-premise reporting, dedicated cloud computing, and big data analytics. Other features that are included in Power BI Premium are increased storage, higher refresh rates, and a larger data capacity. Premium grants enterprise-wide access and is best suited for large organizations with significant business intelligence requirements.
Implementing Power BI in Financial Services
Power BI has countless applications for alternative asset managers and other financial services companies that span the front, middle, and back office. One of Power BI’s most popular functions is financial management and reporting. QuickBooks Online customers can utilize a preconfigured Content Pack that allows them to quickly construct financial statement dashboards. Users are immediately provided with functionality that comprises customer rankings, profitability trends, and various financial ratios.
Implementing and tracking KPI’s with Power BI allows investment managers to accurately evaluate operations. Best practice is to have KPIs spanning the front, middle, and back office because an unidentified issue in any of the three areas can be detrimental. A few prevalent KPIs are Investment Management Fee Revenue as a Percentage of AUM, Trade Settlements per Back Office Employee, Subscriptions vs. Redemptions, and Trade Error Rate by Asset Class.
Business intelligence can be applied to portfolio management by connecting Power BI to the underlying data sources detailing investments. For instance, asset allocation reports and dashboards allow fund managers to interpret the distribution of funds relatively easily. Another prominent application of Power BI is treasury & liquidity management because data visualizations can be developed to provide detailed breakdowns of cash management, FX hedge balances, and more.
Conclusion
Power BI is a powerful ABI platform that augments a business’s ability to consume data through the creation of interactive reports and dashboards. Business intelligence can be constructed to support any business function with enough data. More importantly, it can be configured to the firm’s unique needs and has the ability to adapt with dynamic business requirements.
FinServ has acquired deep industry and technological expertise through the completion of over 600 engagements at more than 40 of the top 100 Hedge and Private Equity Funds. FinServ can configure Power BI to accurately monitor operations, identify the correct KPIs, properly document business processes, and seamlessly integrate new technologies with existing infrastructure.
About FinServ Consulting
FinServ Consulting is an independent experienced provider of business consulting, systems development, and integration services to alternative asset managers, global banks and their service providers. Founded in 2005, FinServ delivers customized world-class business and IT consulting services for the front, middle and back office, providing managers with optimal and first-class operating environments to support all investment styles and future asset growth. The FinServ team brings a wealth of experience from working with the largest and most complex asset management firms and global banks in the world.
What to Expect When You’re Expecting… a Workday Financials Implementation
Getting Started
After a long selection process, your company decided to go with Workday Financials. You have been sold on the “power of one” and are really looking forward to re-designing your financial processes and finally having a good answer for your auditors. The pre-sales teams have come in and have demonstrated solutions to your current problems. But now the realization sets in….This is going to be a lot of work!
Hopefully, your company has also spent time selecting the right integration partner and have augmented their staff with dedicated internal and external project individuals. A critical first step, is an internal one, spend time thinking about how you want the process to look or what reports you want to produce. This will allow your firm to answer important questions from Workday or the integration partner more effectively.
Workday Methodology
Workday has a formalized methodology and whether your integration partner is Workday themselves or a certified partner, you will find the process to be regimented. The first step in the process is called the Foundation Alignment Sessions (“FAS”). You will be given workbooks to populate which detail your current process. Workday, or the integration partner will ask questions to guide you on how you want this information to be stored in Workday. It is important to note, that a process review is not part of this process. Changes to future processes will be based on decisions made outside of alignment sessions. During the sessions, you may be asked questions to which you don’t know the answer. You may also answer questions having not fully understood the ramifications of the decision. That said, there is still time at this point to re-visit these decisions.
The FAS will cover everything from financial accounting, budgets, expenses, customers, suppliers, banking and any other process or “SKU” that was purchased from Workday. Every session will focus on a business process which is the approval flow associated with the transaction, as well as the key worktags that will need to be populated.
Upon completion of the FAS, the integration partner will conduct a walkthrough of the Workday environment in what is called customer confirmation sessions. This is a chance to fine tune the configuration and make additional decisions.
Testing
After these sessions, the configuration team will update the system and deliver a unit test tenant, at which time, you will be responsible for producing unit test scripts. Upon successful completion of the unit tests (and subsequent updates to the configuration), there will be user acceptance testing (which essentially strings together unit tests) and data conversion. These efforts can be time consuming and should not be underestimated.
A separate wortkstream is needed for managing interfaces (called integrations) and could be with banks or other third-party applications. Additionally, IT is typically involved in SSO and potentially user roles and security. Communication, training and hand holding can be expected.
Go-Live
Your original assessment that this will be a lot of work turned out to be true. However, what you can expect is a powerful platform capable of detailed and flexible analytics to support both your financial and management reporting requirements. Many processes that took you hours or days will be reduced to seconds or minutes. The user community will be capable of self service, which will free up your time to do more value-added activities. Most importantly, the information will be consistent, accurate and necessitate less time with auditors and regulators.FinServ Consulting has been providing technology and business solutions to financial services firms for over 15 years.
For more information on how we can help or guide your strategic direction, please contact us at info@finservconsulting.com or 646-603-3799.
About FinServ Consulting
FinServ Consulting is an independent experienced provider of business consulting, systems development, and integration services to alternative asset managers, global banks and their service providers. Founded in 2005, FinServ delivers customized world-class business and IT consulting services for the front, middle and back office, providing managers with optimal and first-class operating environments to support all investment styles and future asset growth. The FinServ team brings a wealth of experience from working with the largest and most complex asset management firms and global banks in the world.
Top FP&A Considerations for Investment Firms
As investment firms compete for capital, investors along with their consultants have been asking for more information and often want to understand the decision-making process undertaken by investment managers. A thorough analysis of new funds or strategies is required to determine the viability and profitability of new or existing businesses and therefore, whether it’s worthy of an investment.
As data becomes more accessible, GP’s want to leverage this data to help determine what businesses should be expanded or contracted or whether it may be necessary to shift resources.
To make informed decisions, it is critically important to plan and understand profitability and the factors that impact it. Profitability can be analyzed across business lines, geographic regions, office, strategy, product, etc. Many organizations capture costs at the cost center level which may or may not be equivalent to the above groupings. Similarly, income can be captured at the same level or a subset of the above.
The financial planning and analysis (“FP&A”) group within a company, is often responsible for forecasting and analyzing profitability. To fully understand whether a department or business line is profitable, it is necessary to allocate costs and income where applicable to these areas.
Expense Allocations
One of the more time-consuming tasks of the FP&A department is the allocation of costs. At investment firms, the allocation of actual expenses is typically used for management reporting purposes only (and therefore do not impact financial statements). In addition, the results of these allocations can be used as the basis for forecasting future periods.
There are a variety of different approaches to expense allocations with some companies seeking to allocate all management company or administrative expenses to revenue-generating business lines. With this approach, expenses associated with functional areas like IT, HR and Accounting are 100% allocated to revenue areas (e.g. Private Investments, Fixed Income, etc.). The result is a ‘fully loaded’ P&L for these departments. The methodologies used to allocate expenses can be just as varied.
Common allocation methodologies include square footage for rent, headcount for support functions (helpdesk, HR, etc.) and committed capital or AUM for other costs such as accounting fees, corporate legal expenses, and office supplies. Other costs such as market data and research can utilize third-party systems to determine actual usage and act as the basis for cost distribution. Some firms can allocate at a very granular level e.g. IT costs allocated by person who has a cell phone, or laptop, etc. Other firms choose to allocate at a higher level.
Some companies choose to allocate a subset of costs and keep residual balances as corporate expenses. This is often done to eliminate potential issues which may arise when allocated costs can be more ‘expensive’ to a business line than procuring services from third parties or to avoid disagreements over the necessity of certain expenses.
Revenue allocations / Revenue Sharing
When assigning or forecasting revenue, certain companies need to allow for revenue share agreements or for cases when portfolio managers work across multiple business areas. This requires a separate data set that houses this allocation data and can be used to distribute income across the firm.
Intercompany allocations
When allocating revenue or expense amounts across different legal entities, this will result in a ‘due to / due from’ entry in both the sending and receiving companies. It is important to note, that when allocating actuals across business lines, this will lead to a cash event that will require one entity to reimburse the other to clear the intercompany balances.
Above the Line vs. Below the Line
Finally, allocations can be at different levels on a financial statement. Some allocations are made using the same level of detail as the original journal. For example, IT allocations can be made using a specific account such as licensing costs or they can be done more generally as part of an allocation such as IT allocations. Senior management must decide how they would like their financial statements (or forecasted financial statements) to look and choose a methodology accordingly.
Forecasting
Projecting revenue and expenses is one of the more important tasks the Finance team performs. Typically, several iterations of a forecast are performed to predict results using a variety of factors. Firms can use an optimistic version to predict profitability when revenue is high, and expenses are low. Other iterations for pessimistic and likely scenarios are also used.
Rolling Forecasts
Rolling forecasts are useful to highlight actual costs to date against the original forecast. This should give firms insight as to how quickly the firm is burning through their budget and how much additional costs you can expect.
Forecasts using allocations
To properly forecast P&L for departments or business lines, FP&A teams typically utilize similar allocations as discussed above. The basis for forecasted allocations are usually based on actuals or using some assumptions for growth (e.g. headcount will grow at a higher rate for the Equities group and therefore will receive additional allocations in the future).
Technology
It is not uncommon to see Excel being used almost exclusively by FP&A departments at investment firms. The advantages and disadvantages of Excel are well documented, however, the sophistication and flexibility of new systems in the marketplace, make the case for using Excel much less appealing.
There are a variety of applications that streamline allocations, forecasting and the associated reporting. Some firms utilize robust ERP applications that have allocations and forecasting capabilities embedded in the product. The advantage to this approach is that the financial data is already in the software. If data not residing in the ERP package is required, it will need to be added through interfaces or manually through uploads or data entry.
Other solutions include BI tools and data warehouses. The advantage to BI tools is that they tend to make the user interface similar to Excel and therefore more readily adopted by the user community. They also include common spreading or allocation methodologies as part of the standard package.
Similarly, data warehouses can do a really nice job of aggregating all relevant data needed for allocations and forecasting. Depending on the product, certain functions may be easier or more difficult to customize.
Summary
The FP&A team can be a real competitive advantage to the Investment firms that employ them. A well thought out approach aided by technology can add tremendous value to senior management and assist with directional decisions that can lead to maximum profitability.
Understanding the various options from a functional and technical perspective is the first step in creating a best in class FP&A department.
About FinServ Consulting
FinServ Consulting is an independent experienced provider of business consulting, systems development, and integration services to alternative asset managers, global banks and their service providers. Founded in 2005, FinServ delivers customized world-class business and IT consulting services for the front, middle and back office, providing managers with optimal and first-class operating environments to support all investment styles and future asset growth. The FinServ team brings a wealth of experience from working with the largest and most complex asset management firms and global banks in the world.