
In order to understand the capabilities of Power BI, it is best to start with the fundamentals of Analytics & Business Intelligence (“ABI”) and data visualization. The combination of ABI and data visualization allows Power BI to articulate information in a digestible manner that is supportive of intelligent decision making.
ABI tools are user-friendly data management platforms that emphasize self-service and provide analytical functionality ranging from data preparation to insight generation. Business Intelligence (“BI”) leverages historical information while analytics employs modeling and statistics to anticipate future events. Generally speaking, BI is focused on what happened, and analytics is focused on why it happened.
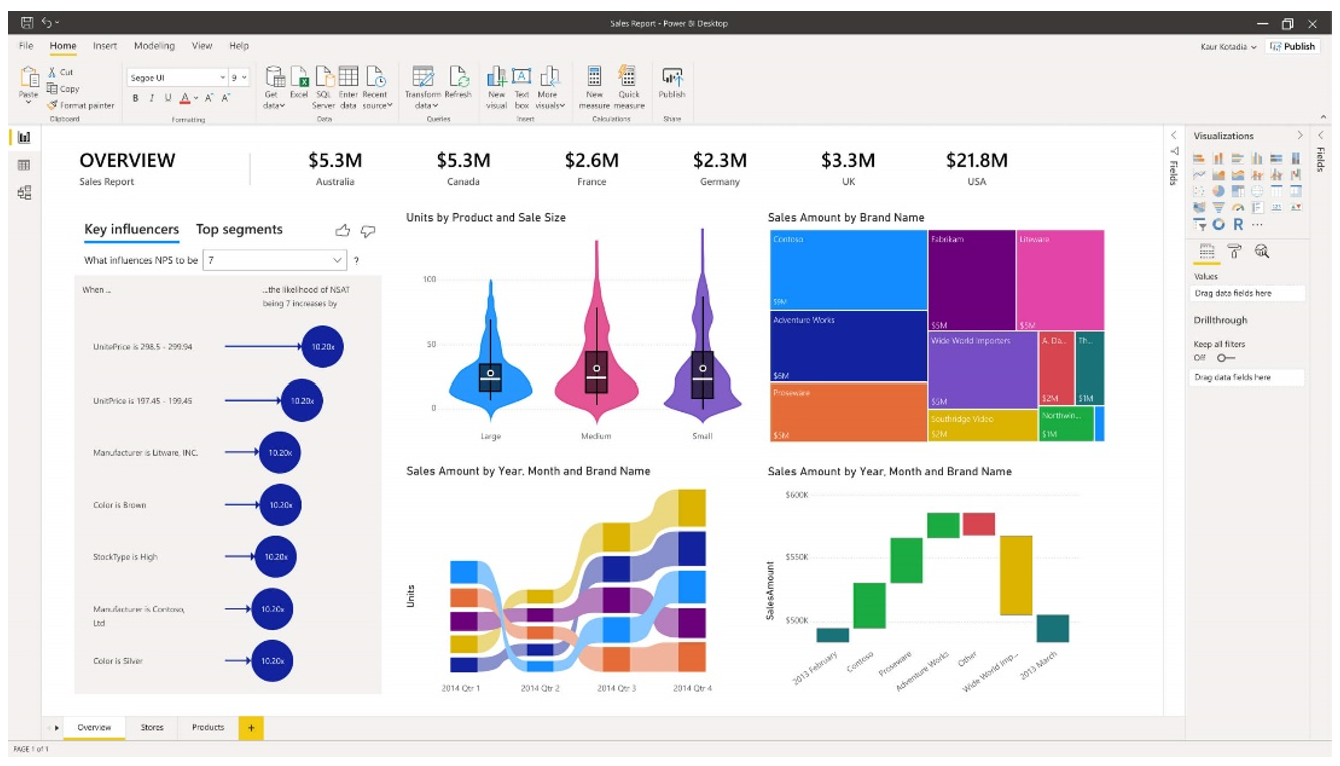
Data visualization is the presentation of information through graphical mediums like charts, diagrams, dashboards, and more. Dashboards are an amalgamation of components designed to inform stakeholders in an aesthetically pleasing manner like the sales dashboard below. The goal is to provide an informative platform that is far easier to comprehend than traditional resources such as a spreadsheet with thousands of rows.
Power BI and Its Key Features
Power BI is a business intelligence solution that enables companies to draw organizational insights by using data visualizations, performing analytics, connecting to hundreds of data sources, and embedding content into external applications & websites. An additional benefit enjoyed by users on the Windows platform is its seamless integration with the Microsoft suite. In summation, Power BI allows users to connect, prepare, model, and visualize data.

Power BI incorporates numerous features (illustrated above) that assist in the analysis and comprehension of a business. Three particularly impressive features included in Power BI’s repertoire are Natural Language Generation (“NLG”), Automated Insights, and Advanced Analytics. NLG uses artificial intelligence to automatically produce rich text descriptions detailing outputs. Automated Insights are conceived from advanced algorithms and are a great way to initiate analysis on large data sets. While the initial analysis generated from Power BI can provide direction for additional research and evaluation, other factors may be sufficiently analyzed within Power BI without the need for further investigation. Advanced Analytics can be performed with Power BI’s internal ABI platform and/or by integrating with external models. Azure Machine Learning Studio’s drag and drop interface can be combined with SQL and R to conduct predictive analytics on data sets.
Subscription Options and Functionality
The three versions of Power BI are Desktop, Pro, and Premium. Desktop, the lowest-tiered option, can be downloaded from the Microsoft Store for free. It includes the core data visualization and analysis features; data preparation, reports, dashboards, connection to over 50 data sources, and the ability to export in various formats.
Pro includes all of Desktop’s functionality and can be purchased as a standalone product for an annual subscription of $10 per user license per month or as part of the Microsoft Office 365 Enterprise E5 suite. The enhancements differentiating Pro primarily fall under collaboration and the distribution of content. For example, users can share their insights by embedding visuals within applications such as SharePoint and MS Teams. Furthermore, users can leverage peer-to-peer sharing to distribute their work to external stakeholders with Power BI Pro licenses.
Premium, the most advanced offering, comes at a hefty annual subscription that breaks down to a monthly price of $4,995 per dedicated cloud compute and storage resource. Some distinguishing characteristics that amplify data analysis include enterprise level BI, cloud & on-premise reporting, dedicated cloud computing, and big data analytics. Other features that are included in Power BI Premium are increased storage, higher refresh rates, and a larger data capacity. Premium grants enterprise-wide access and is best suited for large organizations with significant business intelligence requirements.
Implementing Power BI in Financial Services
Power BI has countless applications for alternative asset managers and other financial services companies that span the front, middle, and back office. One of Power BI’s most popular functions is financial management and reporting. QuickBooks Online customers can utilize a preconfigured Content Pack that allows them to quickly construct financial statement dashboards. Users are immediately provided with functionality that comprises customer rankings, profitability trends, and various financial ratios.
Implementing and tracking KPI’s with Power BI allows investment managers to accurately evaluate operations. Best practice is to have KPIs spanning the front, middle, and back office because an unidentified issue in any of the three areas can be detrimental. A few prevalent KPIs are Investment Management Fee Revenue as a Percentage of AUM, Trade Settlements per Back Office Employee, Subscriptions vs. Redemptions, and Trade Error Rate by Asset Class.
Business intelligence can be applied to portfolio management by connecting Power BI to the underlying data sources detailing investments. For instance, asset allocation reports and dashboards allow fund managers to interpret the distribution of funds relatively easily. Another prominent application of Power BI is treasury & liquidity management because data visualizations can be developed to provide detailed breakdowns of cash management, FX hedge balances, and more.
Conclusion
Power BI is a powerful ABI platform that augments a business’s ability to consume data through the creation of interactive reports and dashboards. Business intelligence can be constructed to support any business function with enough data. More importantly, it can be configured to the firm’s unique needs and has the ability to adapt with dynamic business requirements.
FinServ has acquired deep industry and technological expertise through the completion of over 600 engagements at more than 40 of the top 100 Hedge and Private Equity Funds. FinServ can configure Power BI to accurately monitor operations, identify the correct KPIs, properly document business processes, and seamlessly integrate new technologies with existing infrastructure.
About FinServ Consulting
FinServ Consulting is an independent experienced provider of business consulting, systems development, and integration services to alternative asset managers, global banks and their service providers. Founded in 2005, FinServ delivers customized world-class business and IT consulting services for the front, middle and back office, providing managers with optimal and first-class operating environments to support all investment styles and future asset growth. The FinServ team brings a wealth of experience from working with the largest and most complex asset management firms and global banks in the world.