Business users often struggle to produce reports and conduct analysis without the dependency on their IT team. One of the main reasons is because the users depend on IT to provide the data from many different sources or transform the data in a way that makes it easy to use. Most clients we talk to, say they spend a lot of time waiting for reports from their IT team and this can be frustrating at times. The delays are usually because the IT team has an endless list of user requests and systems projects and often understaffed. The end result is that asset manager’s ability to produce timely reports for key operational purposes or investor inquiries is poor. Leveraging Business Intelligence tools is the way to break this ugly cycle, and enhance your fund’s responsiveness to information requests while also enhancing your reporting with rich and powerful analytics, with little or no IT support.
Microsoft saw the marketplace of Business Intelligence, as a natural extension of their ubiquitous office suite and industry leading SQL Server and Access databases. Microsoft’s entry known as Power BI is one of their latest tools they have rolled out in alignment with Office 365, their cloud-based set of office applications. Power BI has both, a cloud-based and desktop version to support business users in producing powerful visual reports and dashboards from just about any type of data source. The real value of Power BI is that it makes 1) Extracting, 2) Transforming, and 3) Visualizing / Sharing Data something that a business user can accomplish with, little or no support from their own IT team
Extracting Data
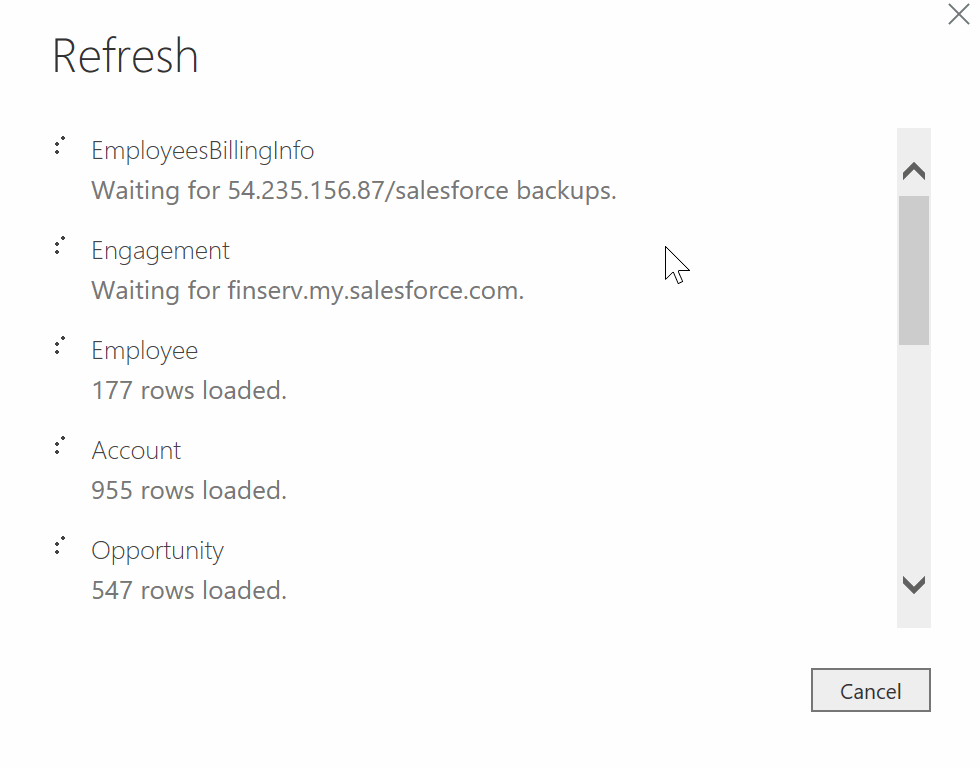
Power BI has pre-built connectors to highly popular data sources Salesforce.com, Google Analytics, SharePoint, Facebook and many other cloud-based systems. These connectors make pulling data from these sources as easy as running through a set of intuitive wizards. In addition, Power BI allows users to pull data from the world’s number one data application, Excel. In addition to Excel, Power BI can also pull data from just about any standard file type like txt, csv, and xml just to name a few. Power BI can also pull from more traditional data sources like Microsoft Access, SQL Server, MySQL, Oracle, Sybase and many other databases. If Power BI does not have a connector you can always download your data from your source into any of those file types and you are off to the races!
One of the biggest challenges in excel is the limitations related to more than one person using an excel spreadsheet at one time. A common scenario is, that Finance is preparing the Net Asset Value (“NAV”) pack for the investors from data they have received from the administrator. At the same time, Investor Relations is responding to an investor inquiry based on that same data. Historically, one user would have to wait until the other user is out of the excel file if they want to update that spreadsheet causing delays and frustration. Power BI facilitates multiple teams simultaneously using the same data for different purposes while ensuring the integrity of that data remains intact and solves this issue by allowing each team to access the same data at the same time. It does this by allowing each group to perform their own transformations on the underlying data without affecting the underlying source of the data (the feed from the administrator).
Once your data source is established and your data changes, you simply click the refresh button on Power BI’s Main Menu Ribbon and your data is automatically refreshed


Transforming Data
The real magic of Power BI is in its Transformation Capabilities. Just like Excel, Power BI offers the user a very familiar and user-friendly way to update your data. However, the key difference between the way most people use Excel, and how Power BI works, is that when you modify your Data in Power BI, it never forgets what you did or loses the linkage to your original data source. It does this magic by memorizing the steps you took to change your data and each time you update the data from your data source, you simply press refresh and it repeats those same updates you made to the new data. Just like that, you have all your data just how you need it without having to repeat and potentially make a mistake with your modifications.
To illustrate some of the most common data manipulations capable in Power BI, we will work through an example of a typical way, a user would need to modify some data from Excel. In our before picture below, we have a typical pivot table in excel, which may be great for your accountant who only cares about numbers, but your head of Investor Relations, for instance, is likely to need the same information in a much more visual manner. Many of FinServ’s client projects over the years have focused on how accounting and IR can share the same data for different purposes. In Power BI, with just a few commands in a matter of minutes, any novice user can transform Excel-based tabular information into a report-friendly data set that lends itself perfectly to visual reports and analysis. You can see in our after picture below, how Power BI has transformed the data while recording each step that was taken to organize the data:


- The first command we used was the Transpose Table command which is familiar to many excel users it simply flips the columns and rows in a table
- We then used a simple menu choice, Use First Row As Headers on the Power BI Ribbon to make the first row of data the Field Names for our data
- Next, we simply took the 2 Fields that did not have names and used the
- We then used the Fill Down command, another familiar excel command to simply take the values that were in the data to fill in each rows relative value
- Finally, we used one of the cooler Power BI commands to take the Yearly data that was in columns and convert it to a relational data format, with the Unpivot Columns command
Visualizing / Sharing Data
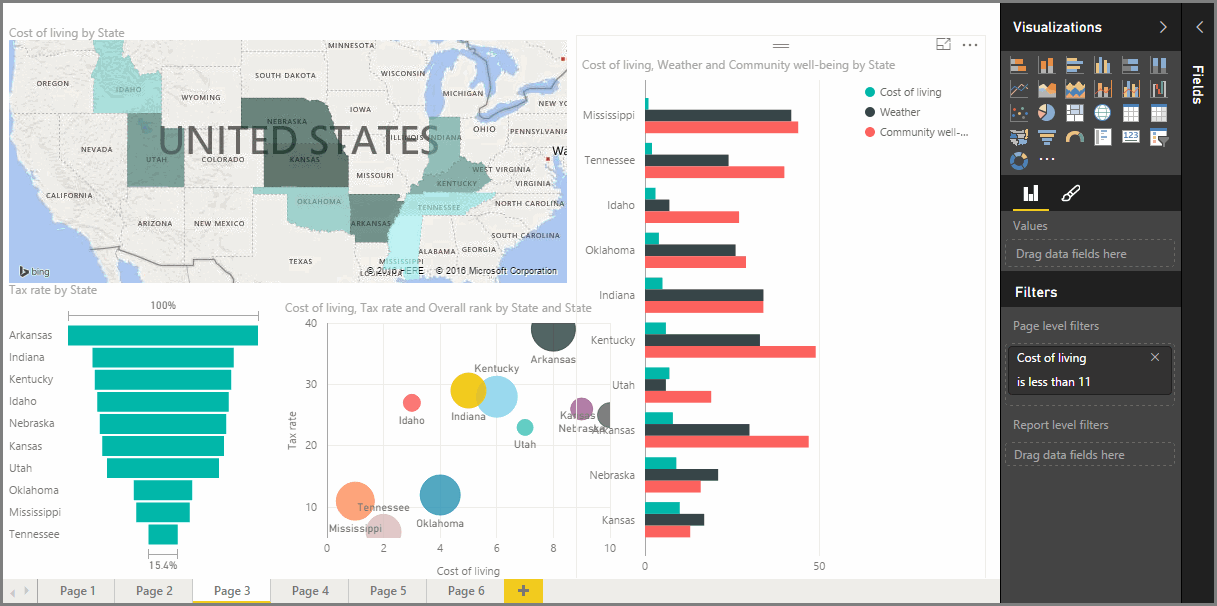
Visualization in Power BI is, taking the dataset you created and applying Powerful Graphics & Charts to make the Information Come Alive with Insights and Meaning. Power BI provides a rich set of options, including various ways to view and interact with your data. The options go from the basic bar and pie charts to cooler and more sophisticated options like Scatter, Geography-based, or even KPI (Key Performance Indicator) charts. Because all the work was done in the transformation step, the Visualization step is a simple matter of dragging the fields onto your chart and the Power BI Engine does the work of creating your charts for you. In fact, if you drag certain types of data onto the Power BI canvas, Power BI in many instances will pick the best chart type for you.


Conclusion
We have really only scratched the surface of what is possible in Power BI. We have not even spoken about all the great integration capabilities Power BI has with the rest of the Office 365 suite such as: Planner, One Drive, SharePoint Online and many more. In future articles, we will go into more industry specific topics and show how specific alternative asset management data can best be leveraged in Power BI. We will also explain how more sophisticated data extractions and visuals can be created all without any programming required.
The bottom line is, with Power BI Microsoft has put a powerful Reporting & Visualization tool in the hands of business users, and given them the ability to Access Data and Transform it into Stunning and Deeply useful Visualizations in a Collaborative environment, greatly reducing the reliance on their IT teams while addressing many of the limitations of Excel spreadsheets.
How FinServ Can Help
FinServ is a Microsoft Cloud Solutions Partner with deep expertise in Power BI . Our team can help you formulate a Power BI project to transform how your organization views and consumes data. For more information, feel free to contact us at info@finservconsulting.com or (646) 603-3799. You can also access this link to fill out your information and we will follow-up with you immediately.
About FinServ Consulting
FinServ Consulting is an independent experienced provider of business consulting, systems development, and integration services to alternative asset managers, global banks and their service providers. Founded in 2005, FinServ delivers customized world-class business and IT consulting services for the front, middle and back office, providing managers with optimal and first-class operating environments to support all investment styles and future asset growth. The FinServ team brings a wealth of experience from working with the largest and most complex asset management firms and global banks in the world.

